by Tim C. Lueth, SG-Lib Toolbox: SolidGeometry 5.6 - Kinematics and Frames
Introduced first in SolidGeometry 5.2, Creation date: 2022-05-18, Last change: 2025-09-15
h=HTplot(T,[Torg])
T: | HT matrix | |
Torg: | Origin of T |
h: | handle to go |
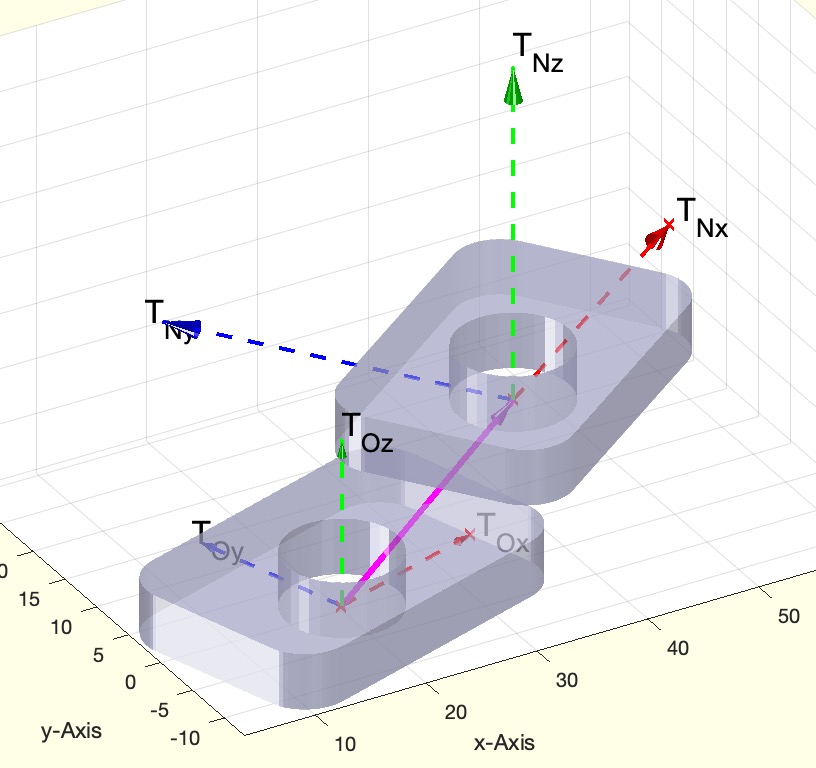
A=SGsample(27); SGfigure(-30,30); T=TofP([20 0 10],rot(0,0,pi/10)); A=SGtransT(A,T);
SGplotalpha(A,'w',0.5); B=SGtransT(A,T); SGplotalpha(B,'w',0.5); HTplot(T,T);This function, HTplot, is designed to plot a homogeneous transformation (HT) matrix in a 3D space. It is part of the SolidGeometry library and is used for visualizing transformations in kinematics and frames.
T. If not provided, it defaults to the identity matrix eye(4), which represents no transformation.Torg using the function getfuncparams. If not specified, it defaults to the identity matrix.T0 by multiplying Torg with T.h to store plot handles.T0 using the function tplot with parameters for size and label, and append the handle to h.Torg using tplot with different parameters for size and label, and append the handle to h.lplot, specifying the color, line width, and style, and append the handle to h.The example provided demonstrates how to use the HTplot function:
A = SGsample(27);
SGfigure(-30,30);
T = TofP([20 0 10], rot(0,0,pi/10));
A = SGtransT(A, T);
SGplotalpha(A, 'w', 0.5);
B = SGtransT(A, T);
SGplotalpha(B, 'w', 0.5);
HTplot(T, T);
This example shows how to create a sample object, apply a transformation, and plot the result using HTplot.