VLNLOLplot
by Tim C. Lueth, SG-Lib Toolbox: SolidGeometry 5.6 - CPL/Closed Polygon Lists
Introduced first in SolidGeometry 5.1, Creation date: 2021-03-14, Last change: 2025-09-15
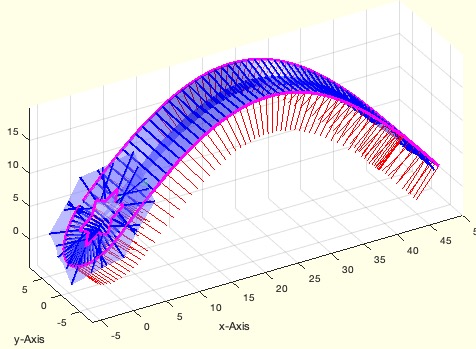
plot an open or closed CVL including Edge Normal Vector and Edge Orthogonal Vector
Description
Auxiliary function for plotting pathes in 3D Space. Similar to the output of VLedgeNormal
See Also: VLedgeNormal
, VLNLplot
, VLELplot
, VLFLplot
Example Illustration
Syntax
h=VLNLOLplot(VL,[NL,OL])
Input Parameter
VL: | | MAGENTA Path, required |
NL: | | RED EDGE Normal Vectors |
OL: | | Blue = Edge Orthogonal Vector; RED=last, Green= first |
Output Parameter
Examples
SGfigure(-30,30); VLNLOLplot(VLsample(15));

SGfigure(-30,30); VLNLOLplot(VLsample(32));
Copyright 2021-2025 Tim C. Lueth. All rights reserved. The code is the property of Tim C. Lueth and may not be redistributed or modified without explicit written permission. This software may be used free of charge for academic research and teaching purposes only. Commercial use, redistribution, modification, or reverse engineering is strictly prohibited. Access to source code is restricted and granted only under specific agreements. For licensing inquiries or commercial use, please contact: Tim C. Lueth
Last html export of this page out of FM database by TL: 2025-09-21