VLNLplot
by Tim C. Lueth, SG-Lib Toolbox: SolidGeometry 5.6 - Analytical Geometry
Introduced first in SolidGeometry 4.3, Creation date: 2018-09-13, Last change: 2025-09-14
plots a normal vector list at a vertex list
See Also: VLplot
, VLELplot
, VLELplots
, VLplotmotion
, VLFLplot
, VLFLplotfacets
, PLplot
, PLELplot
, CVLplot
, CVLplots
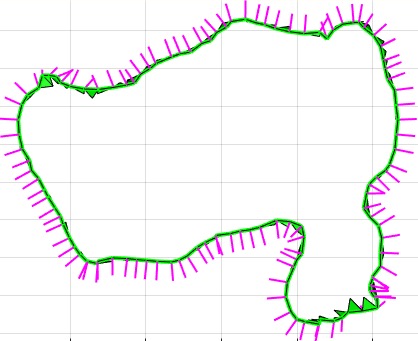
Example Illustration
Syntax
h=VLNLplot(VL,NL,[vi,c,w])
Input Parameter
VL: | | Vertex list |
NL: | | Normal vector list |
vi: | | optional index selector |
c: | | optional color and line |
w: | | optional line thickness |
Output Parameter
Examples
A=SGsample(5); NL=VLFLvertexNormal(A); SGfigure; VLNLplot(A.VL,NL); view(-30,30)
VL=rand(100,3)*10; NL=rand(100,3); SGfigure; h=VLNLplot(VL,NL,1:10,'m.-',1)
Copyright 2018-2025 Tim C. Lueth. All rights reserved. The code is the property of Tim C. Lueth and may not be redistributed or modified without explicit written permission. This software may be used free of charge for academic research and teaching purposes only. Commercial use, redistribution, modification, or reverse engineering is strictly prohibited. Access to source code is restricted and granted only under specific agreements. For licensing inquiries or commercial use, please contact: Tim C. Lueth
Algorithm (Workflow)
This algorithm is designed to plot normal vectors at specified vertices using the function VLNLplot. Below is a detailed explanation of the algorithm and its parameters:
Input Parameters
- VL: Vertex list - A matrix where each row represents the coordinates of a vertex in 3D space.
- NL: Normal vector list - A matrix where each row corresponds to a normal vector associated with the vertices in
VL.
- vi: Optional index selector - A vector specifying which vertices to plot. Defaults to all vertices if not provided.
- c: Optional color and line style - A string defining the color and line style for the plot. Defaults to 'g' (green).
- w: Optional line thickness - A scalar defining the thickness of the lines. Defaults to 2.
Output
- h: Handle to the plot - A vector of handles to the line objects created in the plot.
Algorithm Steps
- Initialize
vi to include all vertices if not specified. This is done by setting vi=1:size(VL,1).
- Set the default color
c to 'g' (green) if not specified.
- Set the default line thickness
w to 2 if not specified.
- Initialize an empty vector
h to store plot handles.
- Calculate the number of vertices to plot,
nV, as the length of vi.
- Compute the size of the bounding box
s using the function sofBB on the selected vertices VL(vi,:).
- Determine the text size
ts based on the number of vertices. If nV is less than 100, set ts=s/50; otherwise, set ts=[].
- Iterate over each vertex index in
vi:
- For each vertex, calculate the endpoint of the normal vector by adding a scaled version of the normal vector to the vertex position.
- Use the function
lplot to plot the line from the vertex to the endpoint of the normal vector, with the specified color, line thickness, and text size.
- Store the handle returned by
lplot in the vector h.
The algorithm effectively visualizes normal vectors at specified vertices, allowing for a clear representation of vector orientations in 3D space.
Algorithm explaination created using ChatGPT on 2025-08-19 01:43. (Please note: No guarantee for the correctness of this explanation)
Last html export of this page out of FM database by TL: 2025-09-21