VLtrans1
by Tim C. Lueth, SG-Lib Toolbox: SolidGeometry 5.6 - Spatial Relations
Introduced first in SolidGeometry 1.0, Creation date: 2012-03-11, Last change: 2025-09-14
moves an object into the first quadrant
Description
This procedure move an object given as vertex list into the first coordinate system's quadrant. All values of x,y,z are zero or positive.
See Also: VLtransT
, VLtransP
, VLtrans0
, VLtransR
, VLtransT
, VLtrans
, VLtransN
Example Illustration
Syntax
[VL,sx,sy,sz]=VLtrans1(VL)
Input Parameter
Output Parameter
VL: | | Vertex list; no value is smaller than 0 |
sx: | | Size in x (also maximum value in x) |
sy: | | Size in y (also maximum value in y) |
sz: | | Size in z (also maximum value in z) |
Copyright 2012-2025 Tim C. Lueth. All rights reserved. The code is the property of Tim C. Lueth and may not be redistributed or modified without explicit written permission. This software may be used free of charge for academic research and teaching purposes only. Commercial use, redistribution, modification, or reverse engineering is strictly prohibited. Access to source code is restricted and granted only under specific agreements. For licensing inquiries or commercial use, please contact: Tim C. Lueth
Algorithm (Workflow)
This function, VLtrans1, is designed to move a 3D object, represented by a vertex list, into the first quadrant of a coordinate system. The function ensures that all x, y, and z values are zero or positive.
Input Parameters
- VL: The original vertex list, which is a matrix where each row represents a vertex in 2D or 3D space.
Output Results
- VLN: The transformed vertex list, where no value is smaller than 0.
- sx: The size in the x-direction, which is also the maximum value in x.
- sy: The size in the y-direction, which is also the maximum value in y.
- sz: The size in the z-direction, which is also the maximum value in z.
Algorithm Steps
- Calculate the size of the vertex list in each dimension using the
sizeVL function, which returns sx, sy, and sz.
- Check the number of columns in
VL to determine if the data is 2D or 3D.
- If
VL is 2D (i.e., it has 2 columns), adjust each vertex by subtracting the minimum value in each column from all entries in that column. This ensures all values are non-negative.
- If
VL is 3D (i.e., it has 3 columns), perform a similar adjustment for the third dimension.
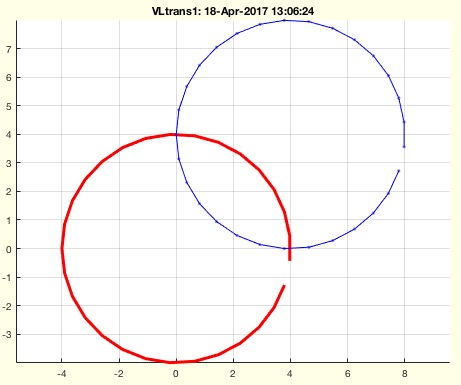
- If no output arguments are specified, plot the original and transformed vertex lists using
SGfigure and CVLplot functions. The original vertices are plotted in red, and the transformed vertices are plotted in blue.
Algorithm explaination created using ChatGPT on 2025-08-19 00:52. (Please note: No guarantee for the correctness of this explanation)
Last html export of this page out of FM database by TL: 2025-09-21