VLtransP
by Tim C. Lueth, SG-Lib Toolbox: SolidGeometry 5.6 - Spatial Relations
Introduced first in SolidGeometry 1.0, Creation date: 2011-12-24, Last change: 2025-09-14
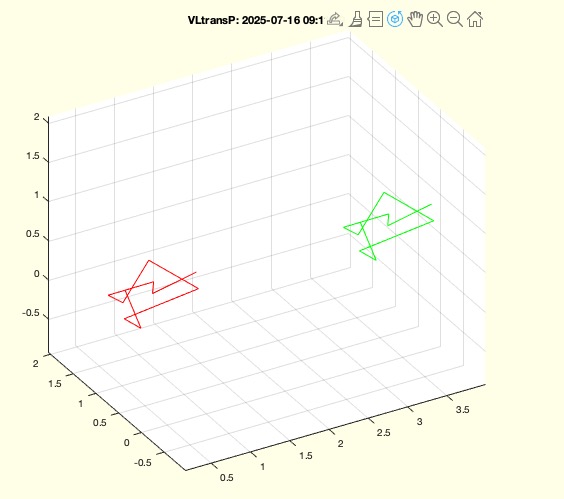
Moves all points of a vertex list using a translation vector p
See Also: VLtransT
, VLtrans1
, VLtrans0
, VLtransR
, VLtransT
, VLtrans
, VLtransN
Example Illustration
Syntax
VL=VLtransP(VL,P)
Input Parameter
VL: | | Orginal Vertex list |
P: | | translation vector |
Output Parameter
VL: | | Transformed vertex list |
Examples
VL=rand(10,3);
VLtransP(VL,[3 0 0])
Copyright 2011-2025 Tim C. Lueth. All rights reserved. The code is the property of Tim C. Lueth and may not be redistributed or modified without explicit written permission. This software may be used free of charge for academic research and teaching purposes only. Commercial use, redistribution, modification, or reverse engineering is strictly prohibited. Access to source code is restricted and granted only under specific agreements. For licensing inquiries or commercial use, please contact: Tim C. Lueth
Algorithm (Workflow)
This algorithm is designed to translate a list of vertices by a given translation vector. It is part of the SolidGeometry library and was introduced by Tim Lueth.
Input Parameters
- VL: The original vertex list, which is a matrix where each row represents a vertex in 3D space.
- P: The translation vector, a 1x3 array representing the translation in the x, y, and z directions.
Output
- VL: The transformed vertex list after applying the translation.
Algorithm Steps
- Store the original vertex list in
VLO for potential plotting purposes.
- Convert the translation vector
P into a column vector to ensure compatibility with matrix operations.
- Determine the number of vertices
n in the vertex list VL. If there are no vertices, the function returns immediately.
- Check if the vertex list has more columns than the translation vector. If so, call
VLaddz(VL) to adjust the dimensions.
- Translate the vertex list by adding the translation vector
P to each vertex. This is done by creating a matrix of the translation vector repeated n times and adding it to VL.
- If no output is requested (i.e.,
nargout==0), plot the original and transformed vertex lists using SGfigure and VLplot functions. The original vertices are plotted in red, and the transformed vertices are plotted in green.
Algorithm explaination created using ChatGPT on 2025-08-18 23:20. (Please note: No guarantee for the correctness of this explanation)
Last html export of this page out of FM database by TL: 2025-09-21