by Tim C. Lueth, SG-Lib Toolbox: SolidGeometry 5.6 - 4Bar/Linkages
Introduced first in SolidGeometry 4.4, Creation date: 2019-01-12, Last change: 2025-09-14
See Also: CPLfourbarlinkage
, fourBarLinkageplotanim
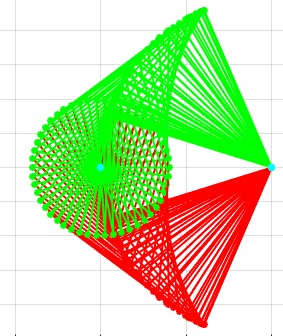
h=fourBarLinkageplot([l1,l2,r,A0,np])
l1: | length of link1 at Base B0 | |
l2: | length of link2 / coupler | |
r: | radius of crank at Base A0 or Point List around A0 | |
A0: | distance, A0-B0, Position of A0 or List [A0;B0] | |
np: | number of points on the crank circle |
h: | handle to last graphics objects |
SGfigure; axis([-100 100 -100 100]); h=fourBarLinkageplot (50,70,50,[30 30; 35 35]); shg
SGfigure; axis([-100 100 -100 100]); h=fourBarLinkageplot (50,70,50,[30 30; 35 35],10); shg
SGfigure; axis([-100 100 -100 100]); h=fourBarLinkageplot (100,70,40,100,50); shg
SGfigure; fourBarLinkageplot(4,4,PLcircle(3,3)+[-4 0]); shg