radofT
by Tim C. Lueth, SG-Lib Toolbox: SolidGeometry 5.6 - Kinematics and Frames
Introduced first in SolidGeometry 4.5, Creation date: 2019-03-21, Last change: 2025-09-14
returns only the radian turning angles of a list of T@ matrices
See Also: TofPLpath
, PLofT
Example Illustration
Syntax
w=radofT(T0)
Input Parameter
T0: | | List of HT matrices in 2D |
Output Parameter
w: | | list of angles (atan2) |
Examples
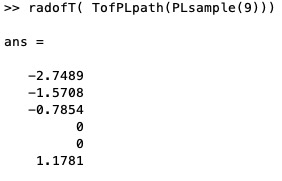
radofT( TofPLpath(PLsample(9)))
Copyright 2019-2025 Tim C. Lueth. All rights reserved. The code is the property of Tim C. Lueth and may not be redistributed or modified without explicit written permission. This software may be used free of charge for academic research and teaching purposes only. Commercial use, redistribution, modification, or reverse engineering is strictly prohibited. Access to source code is restricted and granted only under specific agreements. For licensing inquiries or commercial use, please contact: Tim C. Lueth
Algorithm (Workflow)
This function, radofT, is designed to compute the radian turning angles from a list of homogeneous transformation (HT) matrices in 2D. It is part of the SG-Library and was introduced in SolidGeometry 4.5.
Input Parameters
- T0: A list of 2D homogeneous transformation matrices. Each matrix is expected to be of size 3x3.
Output Results
- w: A list of angles calculated using the
atan2 function. These angles represent the rotation component of the transformation matrices.
Algorithm Steps
- The function first checks if the second dimension of
T0 is 3, which confirms that the input matrices are 2D HT matrices.
- If the condition is met, it calculates the angles using
atan2(T0(1,2,:), T0(1,1,:)). This computes the angle of rotation from the transformation matrix.
- The result is then squeezed to remove any singleton dimensions, resulting in a vector of angles
w.
- If the input matrices are not 2D HT matrices, the function sets
w to an empty array and issues a warning stating that only T2 matrices are currently supported.
- If no output is requested (i.e.,
nargout==0), the function proceeds to visualize the transformation path:
- It extracts the translation components from the matrices and reshapes them for plotting.
- It uses
SGfigure to create a new figure and sets the view to a top-down perspective (0,90).
- It plots the path using
VLplot with magenta color and a line width of 2.
- It calls
tplot to further plot the transformation matrices.
Algorithm explaination created using ChatGPT on 2025-08-18 22:50. (Please note: No guarantee for the correctness of this explanation)
Last html export of this page out of FM database by TL: 2025-09-21