Graphplot
by Tim C. Lueth, SG-Lib Toolbox: SolidGeometry 5.6 - Auxiliary function
Introduced first in SolidGeometry 4.7, Creation date: 2019-07-26, Last change: 2025-09-14
plot a graph with coodinates
See Also: PLplot
, VLplot
, VLELplot
, PLELplot
, CPLplot
, CPSplot
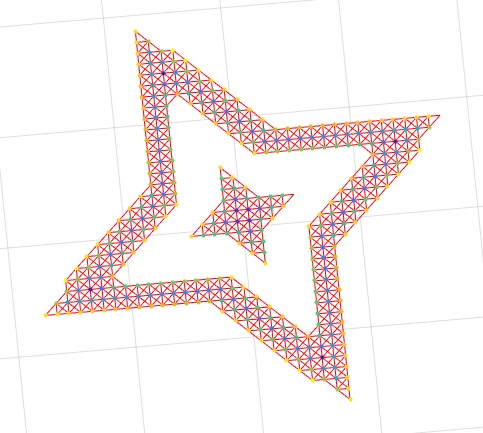
Example Illustration
Syntax
h=Graphplot(G,[GPL,M])
Input Parameter
G: | | Graph |
GPL: | | optional Node Coordinates |
M: | | optional Color Values |
Output Parameter
h: | | handle to graphics object |
Copyright 2019-2025 Tim C. Lueth. All rights reserved. The code is the property of Tim C. Lueth and may not be redistributed or modified without explicit written permission. This software may be used free of charge for academic research and teaching purposes only. Commercial use, redistribution, modification, or reverse engineering is strictly prohibited. Access to source code is restricted and granted only under specific agreements. For licensing inquiries or commercial use, please contact: Tim C. Lueth
Algorithm (Workflow)
This function, Graphplot, is designed to plot a graph with optional node coordinates and color values. It is part of the SolidGeometry library and was introduced in version 4.7.
Input Parameters
- G: The graph to be plotted. This is a required parameter.
- GPL: Optional node coordinates. If provided, these coordinates will be used to plot the nodes.
- M: Optional color values. If provided, these values will be used to color the nodes.
Output
- h: A handle to the graphics object created by the plot.
Algorithm Steps
- Retrieve optional parameters
GPL and M using the getfuncparams function. If not provided, they default to empty arrays.
- Check if both
GPL and M are empty:
- If true, plot the graph
G using the default plot function and return the handle h.
- If only
M is empty:
- Convert the edges of the graph
G to an array using table2array.
- Plot the nodes using
VLscatter with the coordinates from GPL.
- Draw the plot immediately using
drawnow.
- Plot the edges using
VLELplots with a red line style ('r-').
- Combine the handles from the node and edge plots into a single array
h.
- If both
GPL and M are provided:
- Convert the edges of the graph
G to an array using table2array.
- Plot the nodes using
VLscatter with the coordinates from GPL and color values from M.
- Draw the plot immediately using
drawnow.
- Plot the edges using
PLELplot with a red line style ('r-').
- Plot the nodes again using
VLscatter with the same coordinates and color values.
- Delete the initial node plot handle
h1 to avoid duplicate plots.
- Combine the handles from the node and edge plots into a single array
h.
Algorithm explaination created using ChatGPT on 2025-08-18 23:55. (Please note: No guarantee for the correctness of this explanation)
Last html export of this page out of FM database by TL: 2025-09-21