by Tim C. Lueth, SG-Lib Toolbox: SolidGeometry 5.6 - Kinematics and Frames
Introduced first in SolidGeometry 5.1, Creation date: 2021-03-14, Last change: 2025-09-15
h=TLplots(TL,[]);
TL: | Lust of HT matrices |
h: | handle to graphics |
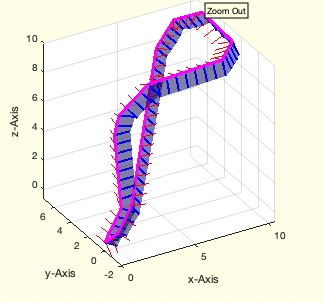
SGfigure(-30,30);
TLplots(TLofCVL(VLsample(8),03));
This function, TLplots, is designed to plot a list of homogeneous transformation (HT) matrices, displaying the plane, normal vector, and orthogonal vectors. It is part of the SolidGeometry library and was introduced in version 5.1.
TL:
VL: Extracted from the fourth column of the first three rows of each matrix in TL. This represents the Z vector.NL: Extracted from the second column of the first three rows of each matrix in TL. This represents the Y vector.OL: Extracted from the first column of the first three rows of each matrix in TL. This represents the X vector.VLNLOLplot with the extracted vectors VL, NL, and OL as arguments. This function is responsible for plotting the vectors and returning a handle to the graphics object.h is returned as the output of the function.An example of how to use this function is provided in the comments:
SGfigure(-30,30); TLplots(TLofCVL(VLsample(8),03));
This example suggests setting up a figure with a specific range and then plotting a list of HT matrices generated by TLofCVL and VLsample.
Note: The function relies on another function, VLNLOLplot, to perform the actual plotting, which is not detailed here.